What Is a Pie Chart? Definition, Parts and When to Use One
In this article
Definition
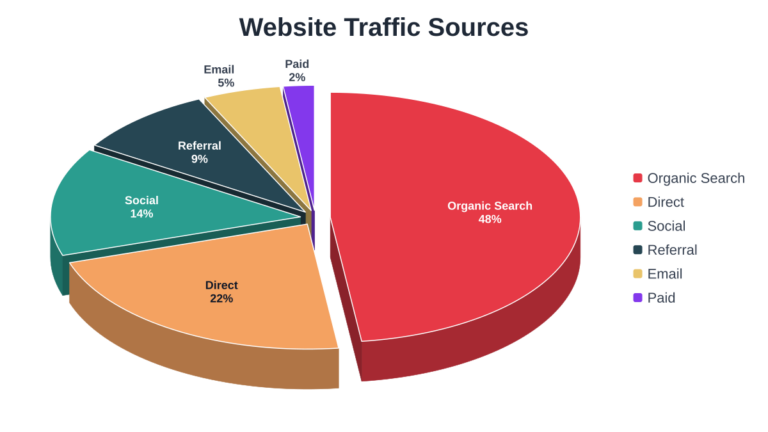
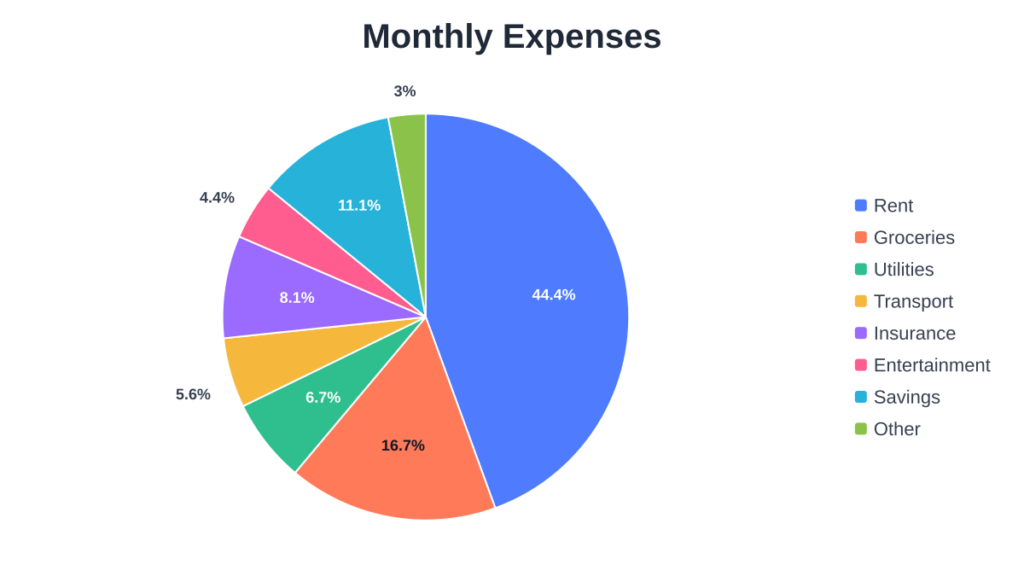
A pie chart is a circular graphic divided into slices. Each slice represents one category, and its size shows that category’s share of the whole. Together, the slices add up to 100%.
Parts of a pie chart
- Slices: the wedges, one per category.
- Labels or legend: tell the reader which color belongs to which category.
- Percentages or values: numbers shown on or beside slices.
- Title: explains what the whole represents, such as “Monthly expenses”.
When to use a pie chart
Use a pie chart when you want to show how parts make up a whole and you have only a few categories. Good examples are a budget split, a market-share summary or survey answers with a handful of options.
When to avoid one
Avoid pie charts when you have many categories, when the values are very similar, or when you need to compare values precisely. In those cases a table is usually clearer. You can also make a doughnut chart by raising the pie hole setting in the pie chart maker.
Next, learn how to calculate pie chart percentages.
Try it yourself. Create your own chart with the free pie chart generator . no sign-up needed.